Beaver Strongholds Framework for Scaling Beaver Re-occupancy at the Watershed Scale
The Beaver Strongholds Framework (BSF) is a field-based approach for identifying and supporting the places where beaver families are persisting at a site with multiple generations—where adults maintain territories, kits mature, and dispersers successfully settle, establish and mature with their own families throughout the watershed. BSF pairs a protocol for mapping Beaver Strongholds of territorial persistence with a strategy for supporting these ecological cores, removing obstacles to expansion success and for conservation practitioners to prioritize watershed-scale, beaver-based restoration.
The approach emphasizes:
- Supporting existing population centers - Beaver Strongholds - where beaver families are flourishing and persisting at forage sufficient locations
- Strengthening habitat connectivity to support natural recolonization
- Establishing measurable, repeatable methods to plan, track, and evaluate progress
- Supporting landowners with conflict-mitigation support where beaver activity overlaps with human infrastructure
The outcome is a shared vision for watershed-scale beaver re-occupancy and landowner support—a roadmap for long-term riparian recovery and community resilience.
From the Pond View: Building Outward from What’s Working
Borrowing from the Sage-Grouse Initiative’s Defending the Core conservation strategy, the Beaver Strongholds Framework begins with what’s already succeeding. Rather than spreading beaver restoration effort thinly across opportunistic sites, the framework focuses resources around areas where beavers are already demonstrating durable occupancy—the strongholds—and builds outward from those ecological cores.
Strongholds are not places where beavers are placed or relocated. They are places where:
- Beavers have already chosen to stay and invest in family formation, den and dam building, and
- Those places coincide with long-term, renewable forage and site stability capable of sustaining continued use.
Recognizing and supporting these cores helps ensure beaver persistence while enabling natural expansion into nearby suitable habitat. The goal is to protect, reinforce, and grow from strength—expanding occupancy over time from “the pond view.”
Supported by Field Data and Observation
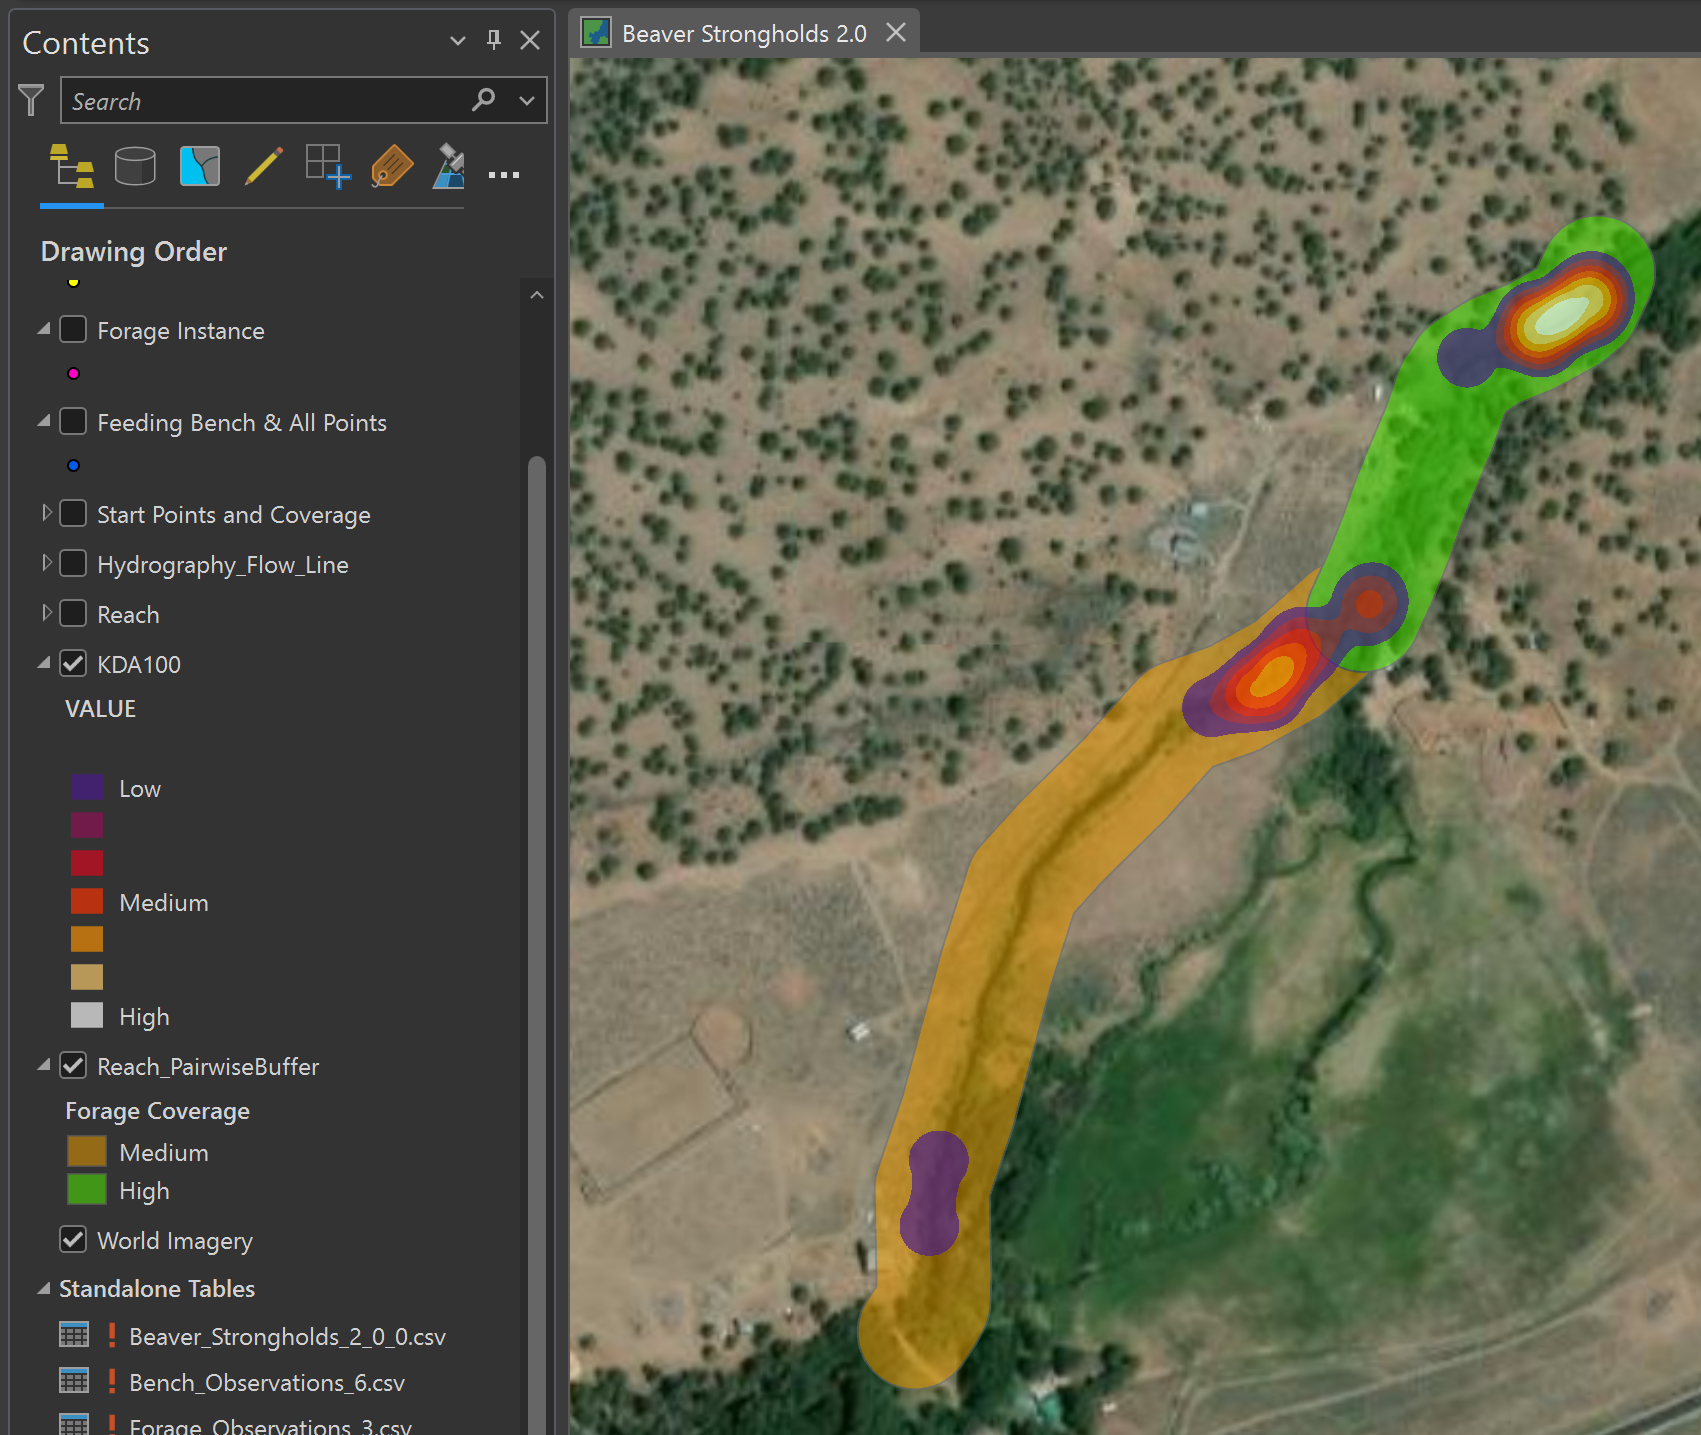
The framework is grounded in Beaver Occupancy Intent and Forage Availability Data Collection, a field protocol that documents:
- The six key behavioral signs that indicate territorial investment and persistence (dams, lodges, food caches, scent mounds, forage events, and feeding benches)
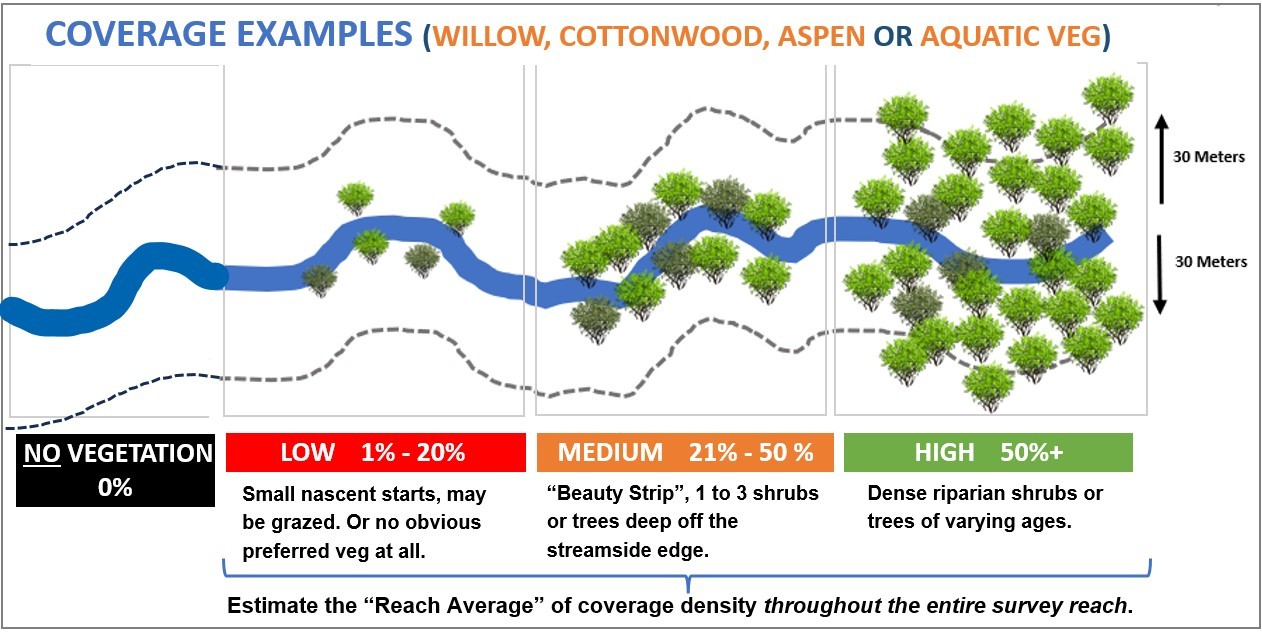
- The availability and regeneration of forage resources that sustain these family groups
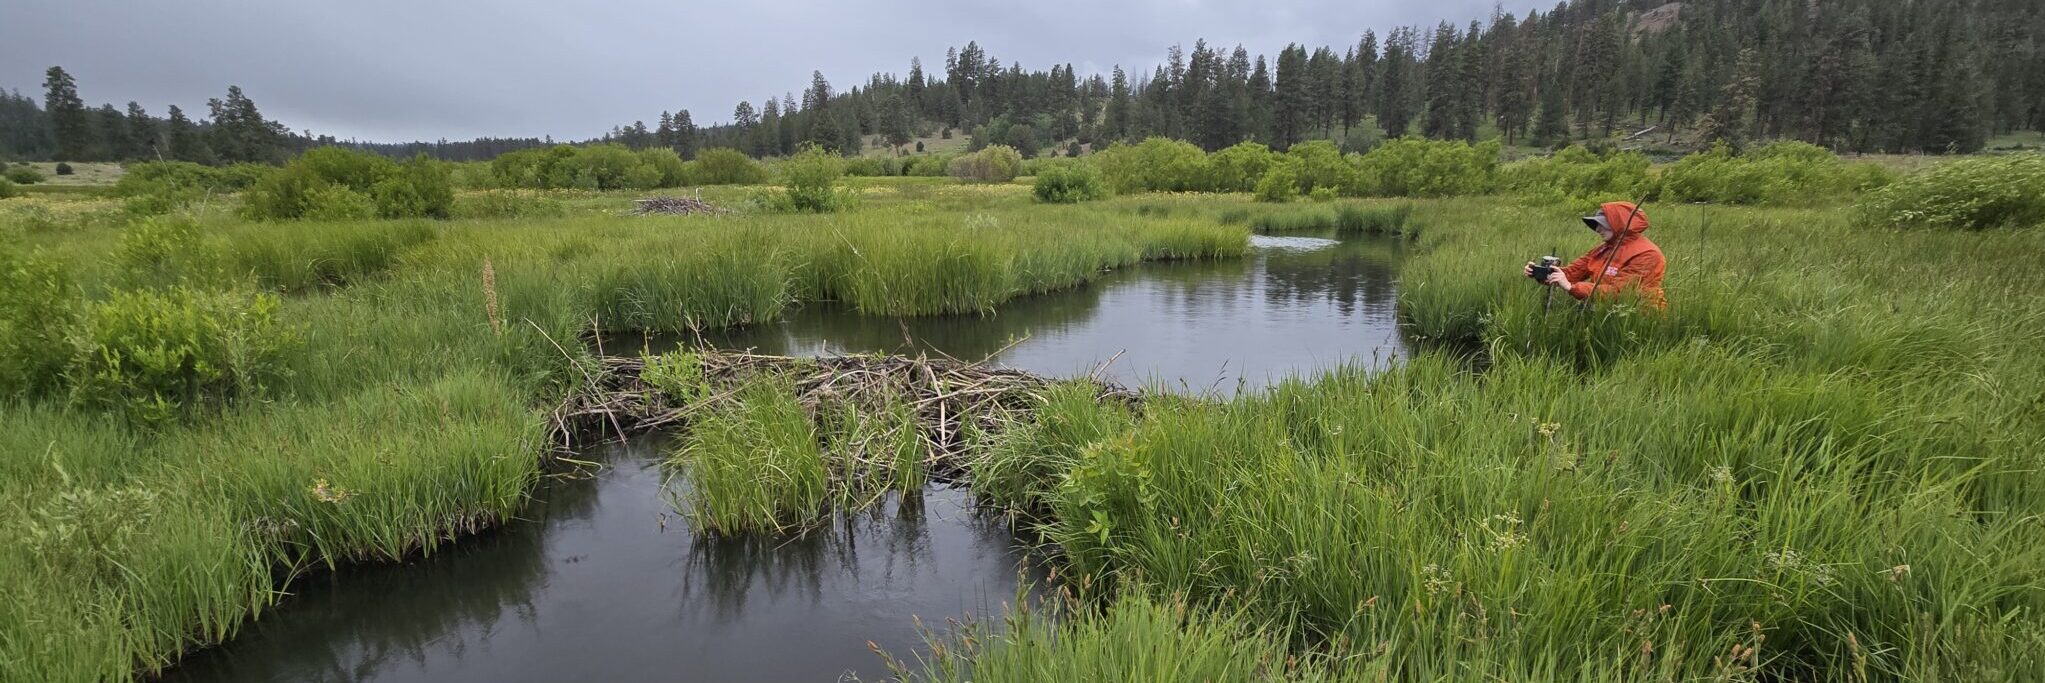
Surveys are conducted using a continuous-walk census approach, recording all current beaver activity and habitat indicators along the stream corridor. These data directly inform stronghold mapping and guide prioritization of restoration actions.
From Strongholds to Watershed-Scale Planning
Mapped strongholds serve as anchor points for coordinated stream and riparian restoration—helping practitioners move beyond scattered projects toward landscape-level planning at meaningful geomorphic and hydrologic units (for example, the HUC12 scale).
The Beaver Strongholds Framework helps guide investment toward:
- Linking strongholds to recolonization zones through improved habitat continuity (see Stepping Stone Strategy, Wang et al., 2023)
- Expanding forage resources through riparian planting and vegetation recovery
- Restoring hydrologic function using low-tech, process-based approaches (e.g., BDAs, PALs, PBR)
- Addressing infrastructure conflicts that restrict beaver movement and persistence
This approach supports beavers where they already succeed, fostering stable family formation, persistent occupancy, and site fidelity that reduces risks associated with full-family dispersal.
Long-Term Vision
By building outward from existing Beaver Strongholds, practitioners and communities can create a long-term, watershed-scale vision for beaver re-occupancy. This structured, data-supported approach increases the efficiency, effectiveness, and durability of restoration efforts—helping Eastern Oregon’s riverscapes recover their natural capacity to store water, sustain vegetation, and buffer against drought.
Additional Resources
- Beaver Restoration Assessment Tool (BRAT) by Wally MacFarlane, Utah State University; modeling geomorphology, hydrology, and dam-building capacity (Riverscapes Data Exchange)
- Non-invasive trail-camera monitoring – for deeper observing and understanding Stronghold family groups
BEST USE CASE
This Beaver Strongholds Framework (BSF) and protocol for mapping Beaver Occupancy Intent and Forage Availability is best utilized on high-desert landscapes and wadeable stream systems—generally 1st through 4th order tributaries within persistent or intermittent basins. These are the kinds of places where survey crews can walk the channel and riparian corridor, observe active beaver use directly, and document both occupancy intent and forage availability with accuracy.
The method is well-suited to valley-floor and headwater reaches typical of Oregon’s interior basins, where flow conditions, vegetation, and geomorphology vary across short distances. Applying the protocol in these settings allows for consistent data collection across diverse watershed types and a clear understanding of how beavers are using—and attempting to use—available habitat across the high-desert landscape.
Beaver Strongholds Is Not:
- A hydrologic FIS model or random-sample mapping tool.
- A beaver population census — rather, it’s a launch point for identifying where deeper focus is warranted through trail cameras, seasonal revisits, or site-level family group evaluations.
- A fully field-tested product — while the protocol has been used successfully at the subwatershed scale within the Crooked River Basin, Fall 2025 marks its first full-scale deployment. The tool will continue to improve through field use, and we welcome input and collaboration to refine it further.
This Protocol 2.0 is the foundation of a broader field-testing effort to improve how we assess and support natural beaver recolonization—by helping established, persistent family groups mature, disperse, and successfully settle into new territories.
Your feedback, field insights, and collaboration are encouraged and appreciated. Reach out anytime at reese@westernbeavers.org.
THE PROTOCOL
The protocol for mapping Beaver Occupancy Intent and Forage Availability is designed as a fall field census—conducted when beavers are most active establishing or reinforcing territories and preparing for winter. Data collection focuses primarily on current, active beaver activities observed during this seasonal window: maintained dams, fresh lodges or burrows, food caches, recently used scent mounds, active feeding benches and signs of foraging. Each activity is mapped with GPS precision and forms the basis of a Kernel Density Analysis (KDA) to identify concentrated areas of sustained activity and territorial intent.
While survey crews also record historical references—older dams, weathered wood piles, or long-abandoned lodges—these are noted only for context. Because nearly every tributary in our survey areas shows some evidence of historical beaver presence, such information is logged but not used in KDA scoring. This prevents conflating legacy signs with active occupation and ensures the resulting density maps reflect current ecological function, not the ghosts of prior generations.
The activity scoring system evaluates six key behavioral categories that collectively describe the degree of occupation and landscape modification: dams, lodges or burrows, canals, scent mounds, feeding stations, and woody foraging sites. Each type receives a baseline score, and four of the six categories are further rated for size or quality of effort, because beavers express their territorial investment through engineering and maintenance effort. Some sign types are ephemeral, such as a single fresh chew pile, while others represent months or years of use and growing family size—for example, expanding lodge or den footprints, or large, well-stocked food caches that grow with maturing family groups. Treating all sign types equally would cause KDA outputs to over-emphasize survey intensity or scattered foraging, while under-representing the centers of long-term occupation where real territorial commitment occurs. By weighting according to behavioral effort and persistence, the resulting density surfaces highlight the true “home base” territories rather than transient feeding zones (for example, beavers just passing through).
To complement activity scoring, forage availability is evaluated at each reach to gauge the land’s capacity to sustain beaver families over time. Surveyors assess the proportion of available woody forage (both Preferred and Secondary forage species) within a 30-meter (~100-foot) “safe foraging distance” on both river right and river left. The threshold for sufficient forage availability is roughly 40–50 percent coverage within that buffer. Below that level, even high-intensity activity may represent short-term occupation rather than a viable long-term territory. In other words, high occupancy intent does not necessarily equate to high family group fitness—a site can be energetically rich in current sign but ecologically poor in future potential.
By pairing occupancy intent with forage availability, Western Beavers distinguishes between active but marginal sites and true strongholds—those reaches capable of sustaining generational site fidelity. The resulting maps provide restoration planners a clear, spatial understanding of where beavers are not only present, but poised to persist.
DATA COLLECTION
Field surveys for collecting data are conducted using a continuous-walk census approach, rather than at predefined reaches, with coverage determined in the field based on the total time available to the survey crew. We recommend defining reaches by either timed intervals or distance, depending on study design—for example, 500-meter segments or 45-minute survey intervals.
The active field form—linked to the Western Beavers ArcGIS account—is available through Survey123 at:
https://arcg.is/1jiCmv0
Data collection uses ArcGIS survey tools for capturing observations, waypoints and photos while maintaining a standardized data structure.
Guidance: For detailed protocols and visual references to support field work, we offer this Beaver Occupancy Intent and Forage Availability 2.0: Data Collection, guide which provides step-by-step guidance and imagery for effective use of the Survey123 form above.
Standalone Use: The Survey123 form and database package can be provided separately upon request for independent or partner-led projects that follow the same data structure.
This standardized approach ensures that observations of beaver occupancy intent and forage availability are collected consistently across riverscapes.
This is Version 2.0 of the Beaver Strongholds Survey123 form is published August 2025 and is being finetuned monthly. We welcome form feedback with improvement suggestions, either within the form field with each survey or by email to reese@westernbeavers.org.
Thanks to our Contributors
Big thanks to Nick Weber, Sam Pappas and Natalie D'Souza for their valuable contributions in developing this form, along with inspiration and support from Wally M. and his team. We gratefully acknowledge the many practitioners and volunteers who contributed to the testing, enhancement and refinement of this tool.
MAP LAYERS AND ANALYSIS
The Beaver Strongholds Framework uses mapped data layers to visualize, analyze, and interpret beaver activity and forage availability. Each layer builds from standardized field data collected through the Beaver Occupancy Intent and Forage Availability Survey (Survey123), producing spatial representations that inform where beavers are investing effort, the availability of forage resources available to sustain family groups persistently, and where restoration or management support could enhance long-term persistence.
Layer 1: Beaver Activity Scoring and Kernel Density Analysis (KDA)
Each recorded observation (waypoint/event) is scored using the standardized Beaver Activity scoring system. Points are assigned based on the type and condition of each observed sign of activity—dams, lodges, food caches, scent mounds, feeding benches, and forage events—following the criteria in the Scoring Beaver Activity Intent reference worksheet (e.g., dams: 1–2 pts; lodges: up to 4 pts; food caches and scent mounds: up to 3 pts; feeding benches: 1 pt; and forage events: 0.33 pts per observation).
These point values reflect the level of investment and maintenance activity at each site. Beavers express territorial investment through engineering and maintenance effort; thus, certain signs represent ephemeral activity (e.g., a recent chew pile) while others—such as a maintained dam or lodge—indicate months or years of sustained occupancy.
All scored waypoints are then processed using a Kernel Density Analysis (KDA) with a 1-kilometer search radius. The KDA model aggregates individual sign points to reveal concentrated areas of activity—interpreted as beaver territories or “centers of occupancy.” The resulting density surface distinguishes areas of stronger territorial investment from areas of transient use, providing a visual indicator of persistence potential and family group distribution across the watershed.
In addition to identifying territorial centers, this layer provides a practical launch point to:
a) guide follow-up monitoring through trail cameras or repeat seasonal visits, and
b) observe patterns and trends over time, helping track how occupancy and maintenance investment change with habitat recovery or management actions.
Layer 2: Forage Availability and Riparian Vegetation Coverage
The second layer quantifies the availability of preferred forage within each surveyed reach. Field crews assess canopy coverage of optimal forage species—primarily willows (Salix spp.), aspen (Populus tremuloides), cottonwood (Populus trichocarpa)—and categorize the percentage of safe harvest area within 100' access on river right and river left of the reach increment, in one of four categories: No forage, Low forage (1–20%), Medium forage (21–49%), or High (≥50%) forage coverage.
These values are then mapped using color-coded categories along ODF’s Hydrography Flow Lines (see ODF Hydrography Dataset), spanning from the Survey123 form’s start to end waypoints for each surveyed reach. This layer reveals where riparian vegetation can sustain beaver foraging needs and identifies opportunities for vegetation enhancement to expand suitable territory capacity.
Integrating Layers for Watershed-Scale Insight
When combined, the Beaver Activity KDA and Forage Availability layers create a powerful composite view: where beaver activity is currently concentrated, how strongly territories are established, and where forage resources may support continued expansion or require restoration. Together, these layers inform watershed-scale prioritization—supporting both existing strongholds and the likely pathways of future dispersal and recolonization.
Research and guides that informed the Framework include:
- Using field sign surveys to estimate spatial distribution and territory dynamics following reintroduction of the Eurasian beaver to British river catchments, Roisin Campbell-Palmer;
- Defending the Core and Threat Based Management approach to conservation
- Beaver Restoration Assessment Tool, McFarlane, etal.
- Guidance document: Biophilia Analysis on Home Range Estimation by Natalie D’Souza, Utah State University
Reference literature that links optimal forage coverage/availability to beaver site persistence, including:
- Beaver Habitat Selection for 24 Yr Since Reintroduction North of Yellowstone National Park – Scrafford et al., 2018
- Simulation Modeling of Beaver Foraging and Willow Community Dynamics – Peinetti et al., 2009
- Beaver Carrying Capacity of Certain Streams in North Park, Colorado – MacDonald, 1956
- And the resources at: Riparian Vegetation for Beaver Habitat Establishment